The U.S. Geological Survey just pulled off something that geologists have dreamed of for decades — a complete, interactive map showing what lies beneath nearly every inch of the continental United States.
Announced on August 28, 2025, this national geologic map compiles more than a hundred separate regional maps into one seamless digital tool. Built for everyone from students to engineers, it turns the country’s hidden layers of rock, sand, and sediment into a vibrant, searchable story of Earth’s history — one that’s as practical as it is fascinating.
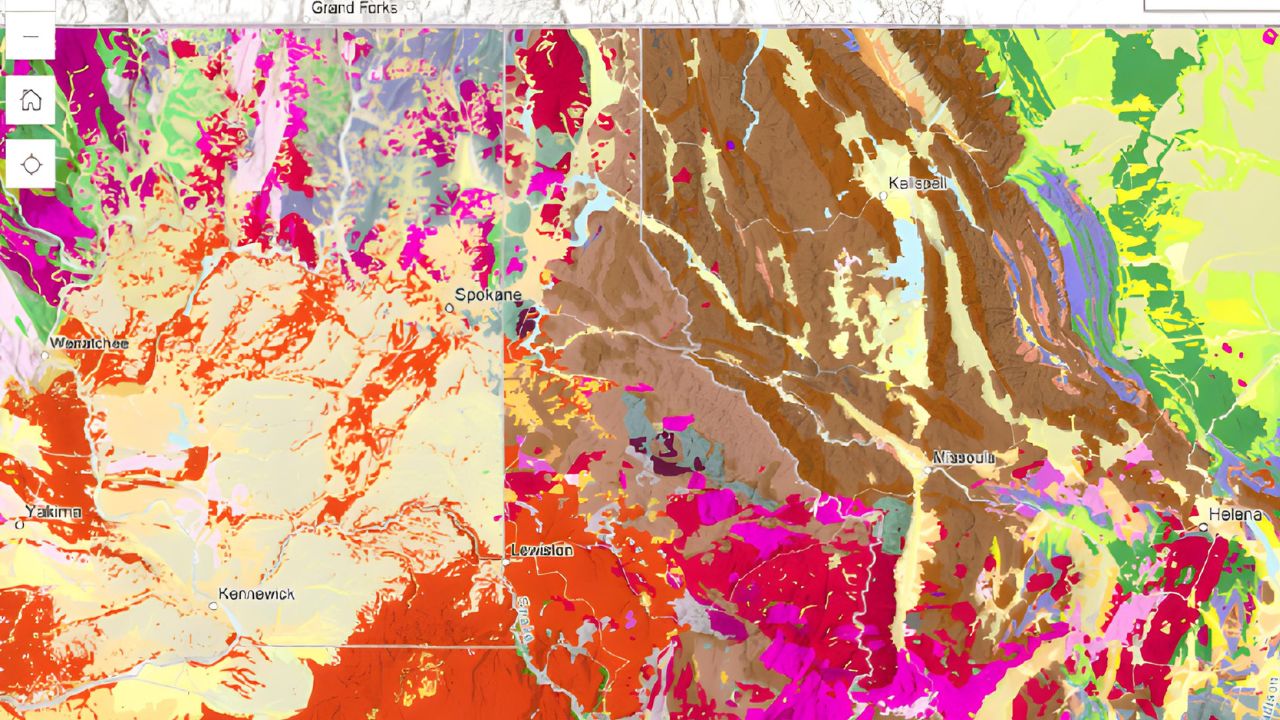
A New Window into the Ground Beneath Us

Until now, understanding the geology of a region meant digging through stacks of local maps, each with its own naming rules and quirks. But this time, the USGS stitched them together into a unified national database, revealing both the materials and the ages of what lies below the surface — from loose river deposits to billion-year-old bedrock.
Joseph Colgan, USGS research geologist and project lead, described it as a turning point:
“We’ve created a single, analysis-ready geologic framework for the entire nation — something consistent, transparent, and easy to update.”

Using a simple online interface, anyone can zoom into their hometown, switch between layers that represent different geologic eras, and instantly see what kind of rocks or sediments lie beneath. Each color-coded unit links to a short description of its composition and origin.
Explore the map here: USGS National Geologic Map Database
Why This Map Matters Beyond Science
This is not just a pretty visualization for geologists. It’s a serious tool for decision-makers.

From infrastructure planning and groundwater management to earthquake hazard mapping and land-use regulation, geologic information underpins billions of dollars in annual decisions.
As Christopher Swezey, coordinator of the National Cooperative Geologic Mapping Program, put it:
“Geologic maps guide everything from where we build schools and bridges to where we search for groundwater and minerals. They even help set insurance rates and building codes.”
In simpler terms: this map can tell a community whether the ground beneath their neighborhood is stable, flood-prone, or sitting on an ancient fault line.
Inside the Layers
The new USGS map is structured into four major geologic “slices,” representing different time scales and materials:
| Layer Type | Focus | Use Case |
|---|---|---|
| Surface Geology | Rocks and deposits you’d encounter on the ground today | Construction, land use, erosion studies |
| Quaternary Deposits | Young materials like river sediments and glacial till | Flood and soil stability modeling |
| Pre-Quaternary Rocks | Older formations beneath modern cover | Energy and mineral exploration |
| Precambrian Rocks | The oldest crustal material, billions of years old | Tectonic research and seismic risk analysis |
You can toggle between these layers to see how newer materials drape over ancient formations — a crucial insight for engineers and environmental scientists.
Built Faster, Smarter, and Ready for Updates
Old national maps often took decades to compile. This one was finished in about three years thanks to new database technology and a standardized workflow.
Sam Johnstone, a USGS research geologist and lead developer, explained:
“Our approach allows us to incorporate new findings almost immediately. The national view no longer needs to be rebuilt from scratch — it can evolve in real time as new data arrives.”
That means as state and federal surveys discover new formations or refine their boundaries, the map can be updated quickly, keeping the digital version fresh and reliable.
Real-World Value: From Classrooms to Construction Sites
The benefits are surprisingly broad:
- Students can explore the planet’s history with a swipe or click, linking geology lessons to real-world landscapes.
- Local governments can use it to decide where to build or where to avoid — saving taxpayer money by steering clear of unstable or flood-prone areas.
- Companies in construction, energy, and agriculture can plan projects with fewer surprises underground.
A national analysis cited by the USGS found that geologic mapping returns between 7 and 10 times its cost through time savings, reduced risk, and better project decisions. And now that it’s digital, that value multiplies — no printing, no shipping, just open data available to everyone.
Safety and Sustainability: Hidden Strengths of Geologic Insight
Beyond economics, these maps can save lives. By showing where fault lines, landslide zones, or loose sediments are located, local planners can target building codes and emergency planning precisely where it matters most.
In a warming world with increasing extreme weather, that kind of foresight can prevent billions in damage — and more importantly, protect communities.
USGS officials say this aligns with a larger push to make public hazard data open-access, helping every city and citizen make informed choices about the land they live on.
What’s Next for the Project
So far, the digital map covers the lower 48 states, but work is already underway to expand it to Alaska, Hawaii, and U.S. territories.
Future updates will tie in with other USGS initiatives, including earthquake monitoring, mineral resource mapping, and climate resilience planning.
Anyone can access not just the visual map, but the underlying geospatial data packages through the National Geologic Map Database — perfect for GIS users, environmental consultants, or curious citizens who want to go deeper.
“This is geology for everyone,” Colgan added. “By putting it online, we’re turning the science beneath our feet into a shared public resource.”
FAQs:
Where can I access the new USGS map?
You can view it online via the USGS National Geologic Map Database or through integrated GIS applications.
Is the tool free to use?
Yes. All data and map layers are publicly available.
Can I use the data in research or business projects?
Absolutely — the data is open-source and downloadable for public and professional use.